Every card. Every race. Every angle.
Click any screenshot to view it full size. All examples are from real Hong Kong race cards.
⚡ Proprietary Speed & Pace Ratings
True performance figures adjusted for track conditions, weight, going, and pace dynamics — not just raw times. Each race header shows the Speed Par so you instantly know what it takes to win at today's class and distance.
- Speed figures with EP / MP / LP / LK pace breakdowns per start
- Speed trend indicators to catch improving or declining form
- HKSR PowerPicks: top three selections per race
- Run-style profiles for every horse

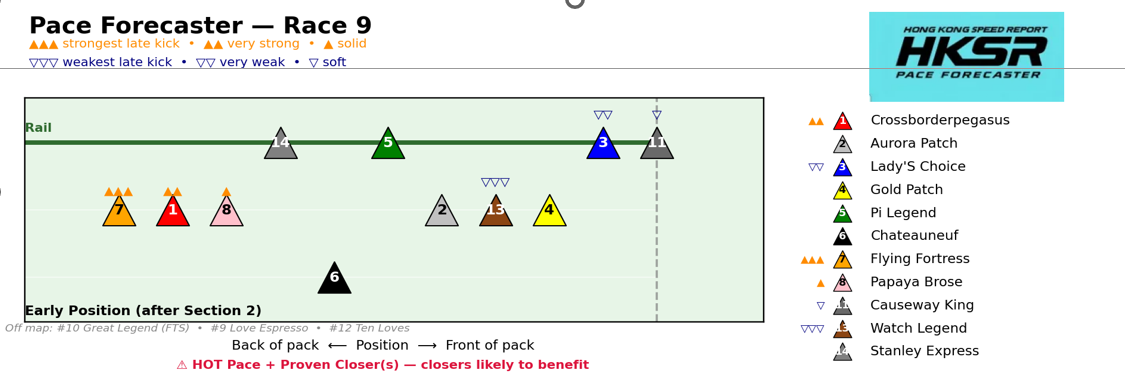
🏁 Pace Analysis & Visual Forecaster
Early, middle, late, and late-kick metrics combined into a projected race map. Our unique Pace Forecaster shows expected early positions and late-kick strength for every runner — spot the tactical advantages before the gates open.
- Projected race flow, visualized per race
- Late-kick strength markers from strongest to weakest
- Pace pressure and flow flags (hot pace, cold pace)
- Draw and early-position projections after Section 2
📈 Trendline Charts
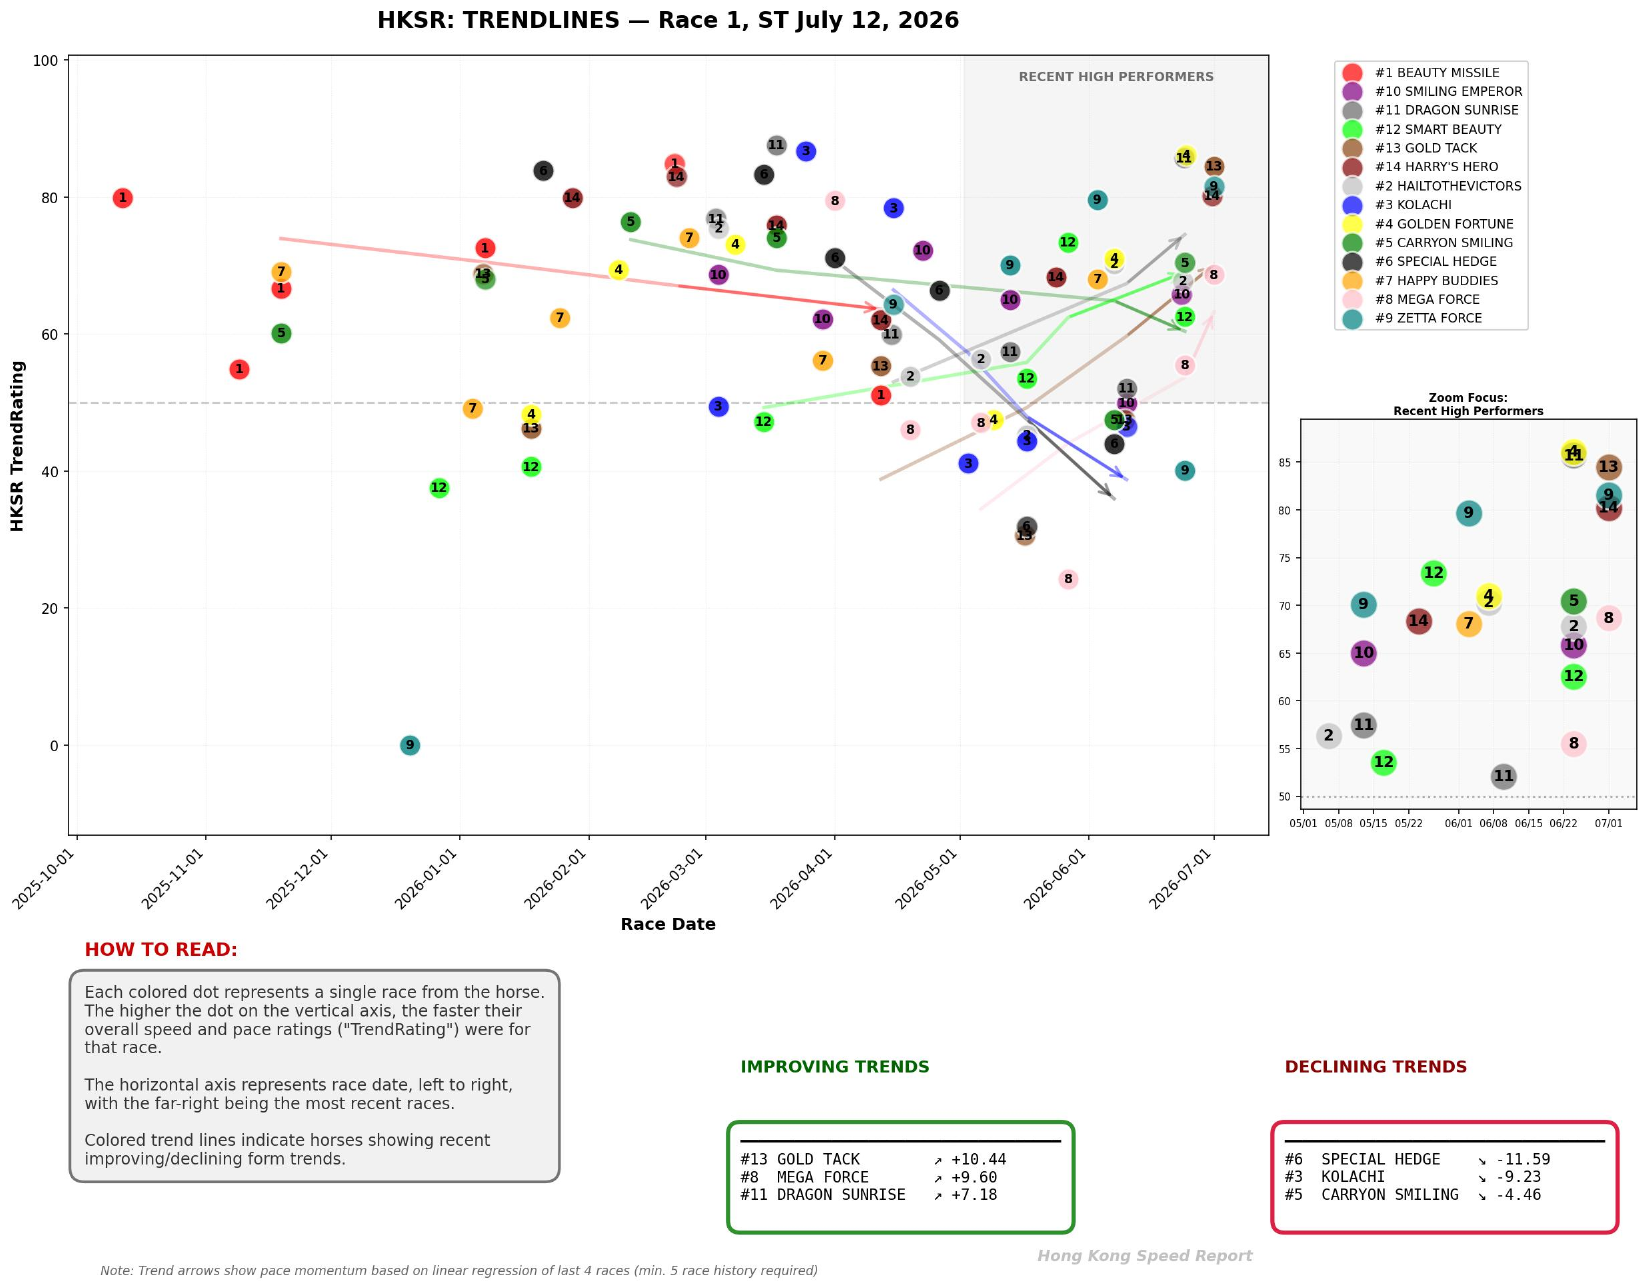
Every runner's figure history plotted on a single chart per race, with trend arrows and a zoom panel isolating the recent high performers. Form cycles, sudden improvement, and bounce risk become visible in seconds.
- All runners' speed figures charted over time
- Recent high performers highlighted and zoomed
- Trend arrows showing direction of form
📄 PDF Pace Report — Form Life-Cycles
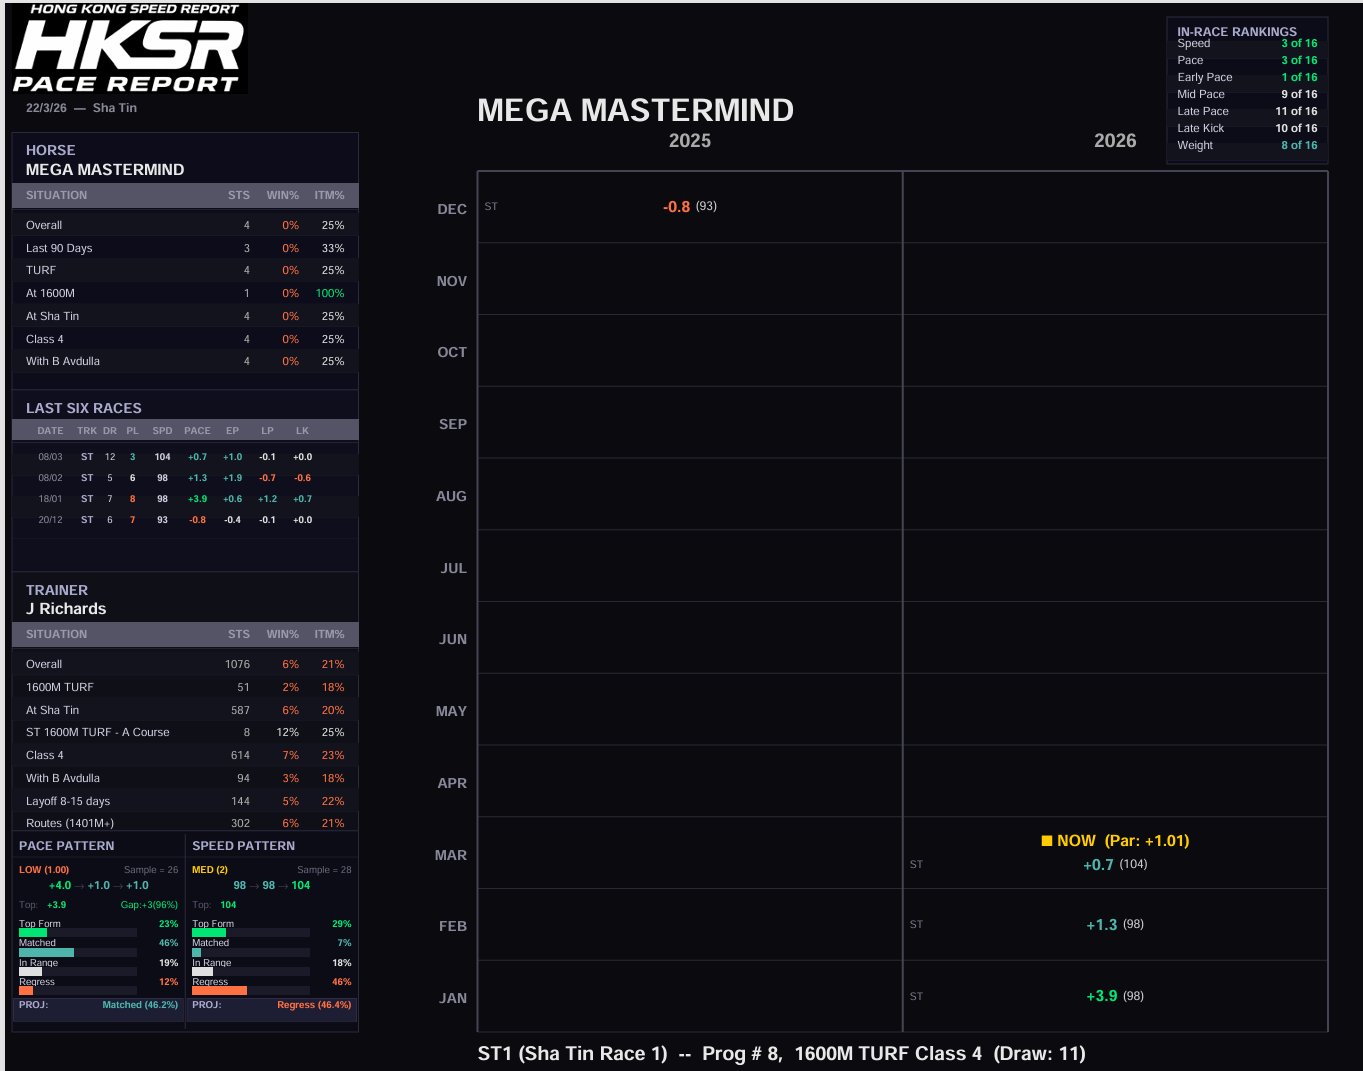
One dark-mode page per horse: a calendar-grid of every start across seasons with figures color-coded by performance, plus situational stats for horse and trainer, active angles, and a Speed Trend Projector estimating whether the horse peaks, holds, or regresses today.
- Multi-season form calendar with figure color-coding
- Horse & trainer win/ITM% by situation (distance, course, class, jockey)
- Speed Trend Projector with probability breakdowns
- Today's race context and par figure
🎯 Validated Predictive Angles
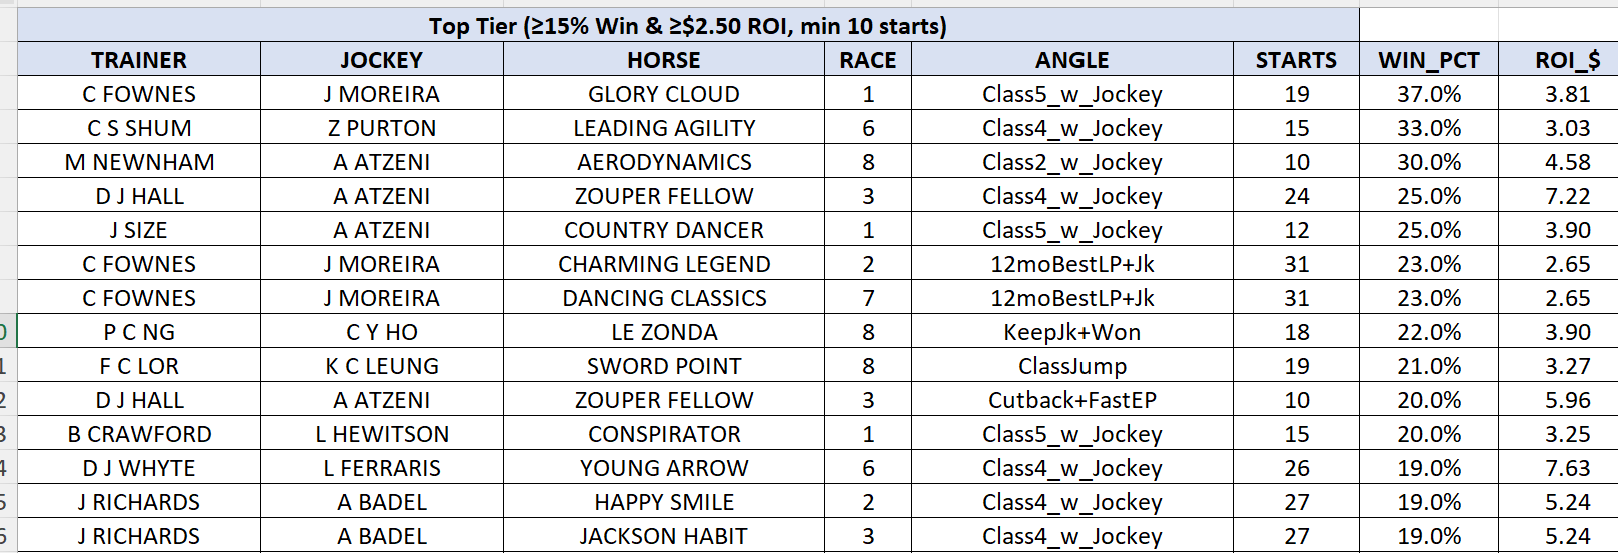
Dozens of wagering angles — jockey upgrades, trainer patterns, class jumps, cutbacks, form cycles — each backtested for positive ROI and ranked into tiers. No black box: every angle shows its sample size, strike rate, and theoretical $2 win return.
- Top Tier: ≥15% win rate and ≥$2.50 ROI, minimum 10 starts
- Angles matched to today's runners automatically
- Jockey/trainer combo stats with win% and ITM%
📊 The Interactive Excel Workbook
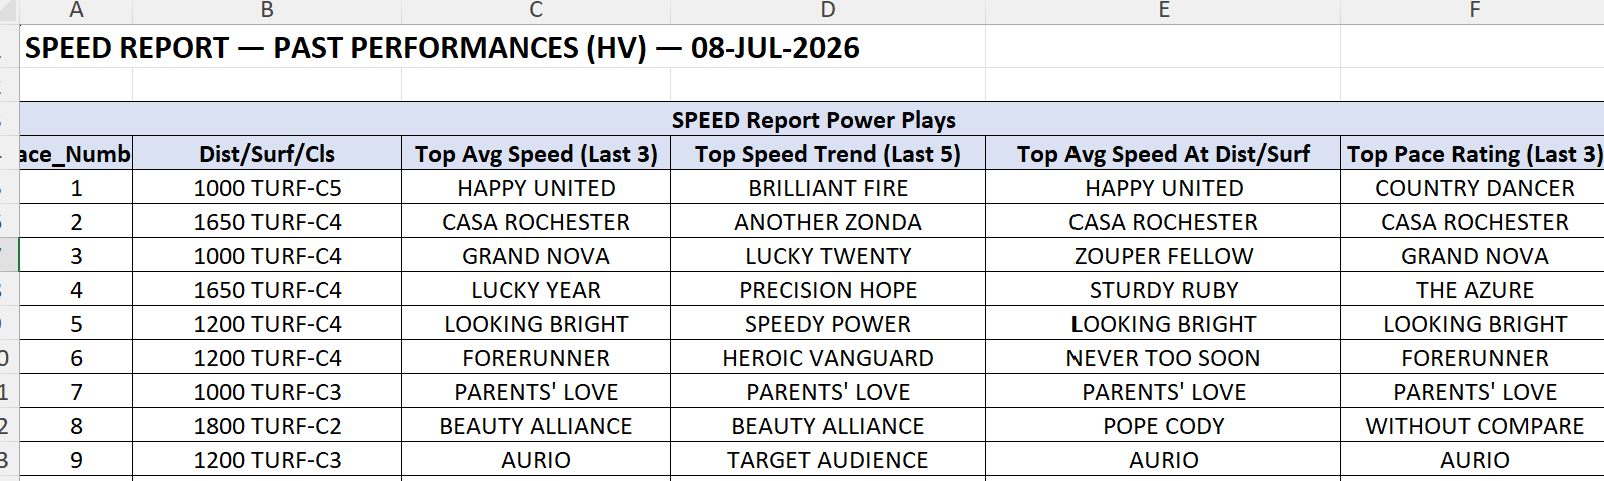
Everything above in one professional workbook per race card — plus barrier analysis by run style, Power Plays summarizing the top-rated horses across four categories per race, and full past performances. Opens in Excel or Google Sheets.
- Power Plays: top avg speed, speed trend, distance/surface, and pace rating per race
- Barrier win percentages by run style for today's course & distance
- Complete PP lines with jockey/trainer angle annotations
- Excel and PDF formats
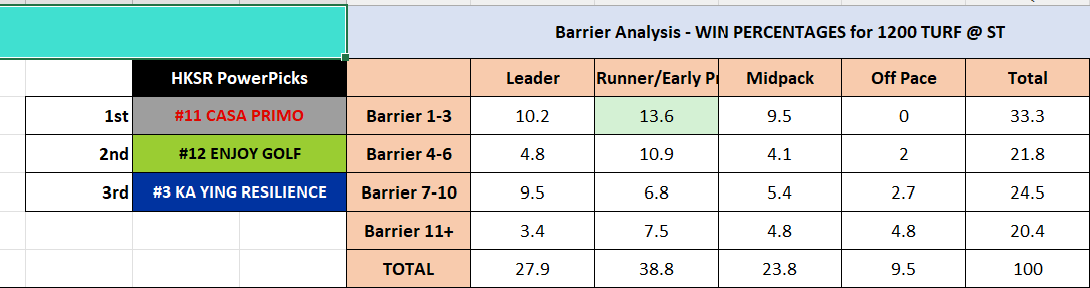
🚪 Barrier Analysis & PowerPicks
Which barriers actually win at today's exact course, distance, and surface — broken down by run style. Combined with HKSR PowerPicks, our top three selections for every race, you know instantly whether the draw helps or hurts each contender.
- Historical win% by barrier group and run style
- Specific to today's course & distance configuration
- PowerPicks: 1st, 2nd, and 3rd selections per race